As you may know, or at least have inferred, I’ve been brewing a lot of pilot batches for 2MBC lately, which may not be the most stimulating way to brew, but does lend itself to collecting some pseudo-scientific data. Specifically, I’ve been able to generate a fairly comprehensive plot of temperature vs. attenuation for my three “house” strains: Wyeast 1272, 2206, and 3522. These are not controlled studies; there are some controls, to be sure, just based on my brewing process and ingredients. Most of the Belgian-style recipes use some flaked wheat, but otherwise there are no adjuncts included. The 44 batches represent 17 different grain bills, not counting minor changes, with original gravities from 10.0°P to 19.0°P, and it shows in the spread of the data. I’ve added trend lines connecting the (arithmetic) mean attenuations to hopefully make things more clear.
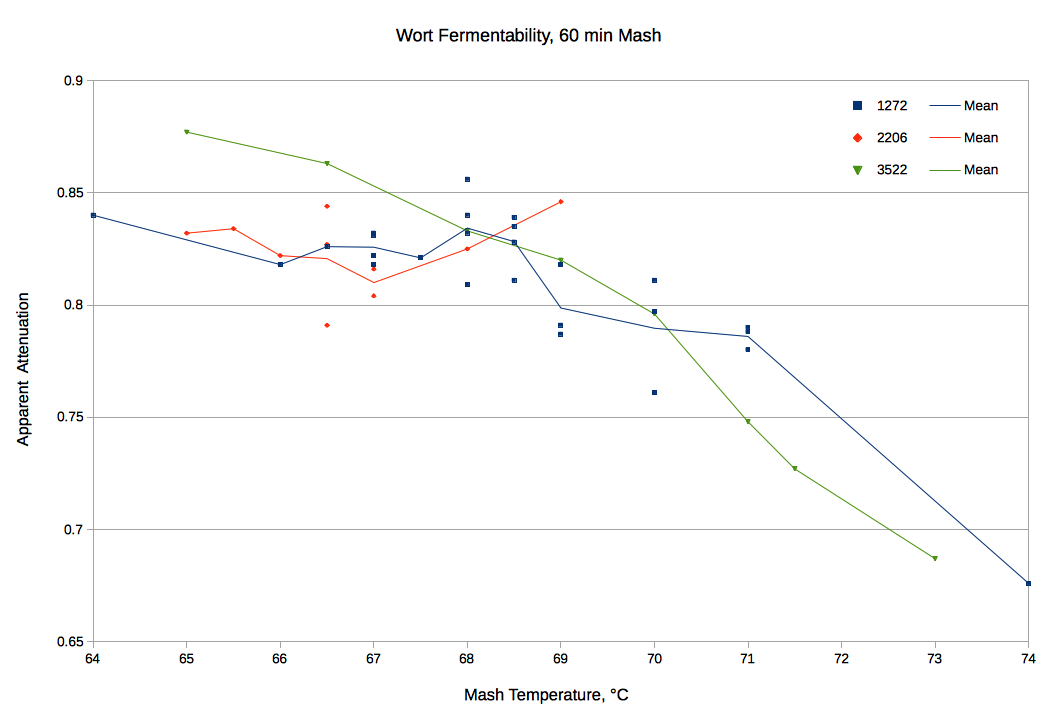
One (perhaps self-evident) takeaway is something that has been pointed out on various brewing forums ad nauseam: the attenuation ranges published by yeast labs are comparative, not prescriptive. The total attenuation range given by Wyeast for these three strains, for example, is 72-77% ADF, and almost all the batches plotted exhibited higher attenuation. Looking at the plots with the benefit of hindsight, you can even see what appear to be two stalled fermentations.
Another result I’d like to highlight is the relatively small range of attenuations for each strain within the “normal” single-infusion mash temperature range. In fact, from 66.5-70.0°C (151.7-158.0°F) the average attenuations for all three strains only range from 79-86% ADF. While it’s likely possible to distinguish beers at the extremes of that range, at least for some recipes, for my own brewing purposes I don’t see any reason to take corrective action provided the mash temperature is within a couple degrees of the target.
Now, on to some analysis of the individual strains:
3522: Either the least interesting, in that the attenuation curve is what might be expected, or the most interesting — because the other two aren’t. The relationship between temperature and attenuation is nearly linear (R2 = 0.95), though with the caveat that this is the smallest data set, at only eight points.
2206: Exhibits no strong correlation between temperature and attenuation — in fact, setting aside the presumptive stalled fermentation, the entire attenuation curve is very nearly within the standard deviation (±1.7% ADF). The caveats here are that the data set is again relatively small (10 points), and covers the smallest temperature range (4.0°C). Unfortunately, the unseasonably warm weather this spring put an early end to my lager brewing.
1272: Given that this is my most commonly-used yeast strain, it should be no surprise that this is also the largest data set. Interestingly, it appears to be a composite of the other strains’ behaviors — the attenuation curve is more or less flat from 64-70°C, above which it drops off sharply. (An argument can be made that the average attenuation at 69°C is artificially depressed by incorporating two batches of porter with high fractions of both crystal and roasted malts.) Again, though, the overall spread in attenuations is quite small. Setting aside the other presumptive stalled fermentation at ~76% ADF and the aforementioned batches of porter, the 19 grists mashed at 64-70°C vary by just ±3% ADF.
So, can we synthesize these results into something like a holistic view of yeast behavior? Probably not. My hypothesis is that what we’re visualizing here is the result of two, or possibly three, yeast phenotypes differentiated by their ability to metabolize maltotriose. Palmer gives a characteristic breakdown of barley wort sugars:
Typical Sugar Profile Extracted From Malted Barley
Maltose 50% Maltotriose 18% Glucose 10% Sucrose 8% Fructose 2% Other Complex Carbohydrates including Dextrins 12% – How to Brew, p. 29
As any brewer knows, every wort is different, but taking these values to be canonical would allow for a difference in apparent attenuation of up to 22%, more than enough to explain the effects seen here. This difference in maltotriose fermentation can in turn be ascribed to the origins of the yeast strains themselves:
[…] it is speculated that the primary Dupont strain descends from red wine yeast […] Beer yeast usually can ferment maltotriose, most wine yeast cannot.
Now, I have no information on the provenance of 3522, other than it was probably sourced from Brasserie d’Achouffe, but given the speculation regarding Dupont’s saison strain, it’s far from unlikely that other strains we think of as “beer yeast” could be maltotriose-inhibited. Conversely, the lack of temperature dependence of the lager strain can also be explained:
The second most abundant fermentable sugar in wort, maltotriose, is often poorly utilized, leading to incomplete fermentation. Moreover, ale yeasts are frequently less effective in maltotriose uptake then [sic] lager yeasts. Maltotriose can be assimilated by the aid of Agt1p, Mph2p, Mph3p, and Malx1p (x = 1-4 or 6) but with a lower uptake rate (Day et al., 2002). Moreover, lager yeast strains contain the gene MTT1, which encodes a maltotriose transporter (Dietvorst et al., 2005).
– Applied Mycology, p. 117
In other words, when it comes to fermenting maltotriose, lager yeast good, ale yeast bad. So why the flat attenuation curve for Wyeast 1272? It’s certainly possible that 1272 has been hybridized or selected for maltotriose uptake, but my guess is that it comes down to choice of base malt, or more accurately, to diastatic power, the concentration of α- and β-amylase in the malt. My American-style ales almost exclusively use Rahr two-row pale malt for a base, as opposed to Weyermann Pilsner and/or Munich for my Belgian-style ales and German… well, German-inspired if not necessarily “German-style” lagers. The higher diastatic power of the Rahr malt (it’s hard to say just how much higher, since Weyermann doesn’t list it in their lot analyses) means that by the end of the mash rest relatively little maltotriose remains, most of it having been reduced to simple sugars — up to a point. Above roughly 70°C, at least in a one-hour mash rest, the malt enzymes are denatured faster than they can break down maltotriose, and attenuation begins to suffer as a result. A follow-up experiment utilizing 1272 to ferment worts from the two base malts would be needed to lend some validity to this hypothesis.
One of the most interesting areas of research within the brewing industry is undoubtedly White Labs’ recent effort to sequence the genomes of their 157 S. cerevisiae strains. The phylogenetic tree generated (Figure 1) provides a handy visualization of what we’ve long suspected — many brewers’ yeasts are, genetically, actually descended from wine strains. Hopefully, as this research continues to trickle down to commercial and home brewers, we’ll rework our expectations for yeast behavior into categories based not on tradition or even sensory analysis, but on hard data.

Awesome experiment, really enjoyed the BBR episode on this too. Thanks for sharing!
When you say “the attenuation ranges published by yeast labs are comparative, not prescriptive,” what exactly do you mean? Comparative to what?
Joe,
What I meant is that, all else being equal, the published attenuations will maintain their relationships to one another. 1056 will most likely attenuate more than 1968, for example, even though the actual attenuations may not be in the published ranges.
Sean
Thank you for sharing this data and insights. I have been plotting my data for 12 years. Unfortunately, I only brew about a half dozen batches per year. Nevertheless, I can confirm I’m seeing the same trend for American ale when I look at WLP001 and US-05. My most interesting result is for Nottingham “Ale” yeast, which is always a very constant 77-78% apparent attenuation no matter what the mash temperature, in the range from 148-158 F (64-70 C). I have 10 data points with two each at the min and max temps, so I think this is worth further exploration. Perhaps Notty is able to eat maltotriose, and maybe it’s even actually a lager yeast, or a hybrid or something. In any case, it is a solid performer, even at cool fermentation temperatures as low as 55-60 F (13-15.5 C), and is used by many for creating lager-like or hybrid beer styles.
Hey Dave,
I think the supposition has always been that Nottingham is either a lager strain or some kind of hybrid given its temperature tolerance. When I was brewing in a basement we played around with it but ultimately found that we could get consistent fermentation out of Chico given a warm start and gradual cooling into the low 50s.
If you’d be willing to share, I’d love to check out your data.
Cheers,
Sean
I’ve seen in some papers that there are indeed many (some?) ale strains that can grow in maltotriose and some lager strains that cannot, so the blanket statement that ale=bad and lager=good cannot be made. Maybe the genetics of 1272 plays more a role than the enzymology of Rahr malts?